Q2 2024 Manhattan Market Report

Q2 2024 Manhattan Market Report

Q2 2024 Manhattan Market Report cover, with a modern living room overlooking Manhattan and the Compass wordmark.


Q2 2024 Manhattan market report summarizing sales, neighborhood trends, luxury properties, and inventory.

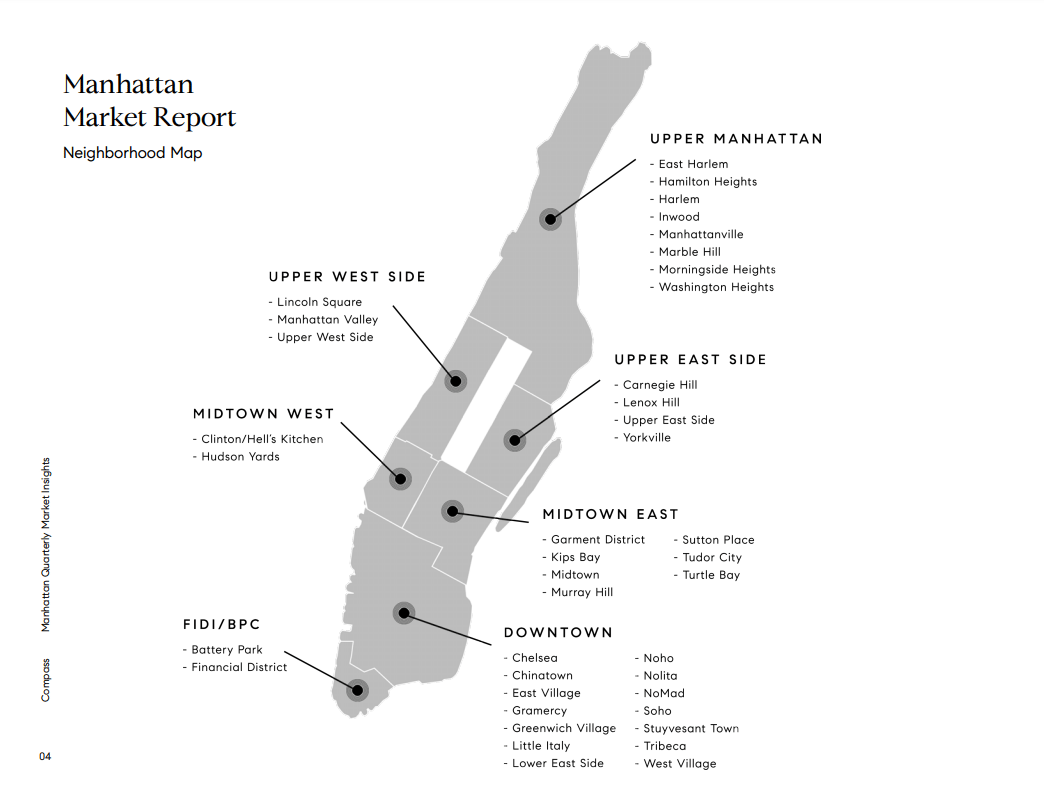
Manhattan neighborhood map with labeled areas from Upper Manhattan to Downtown.


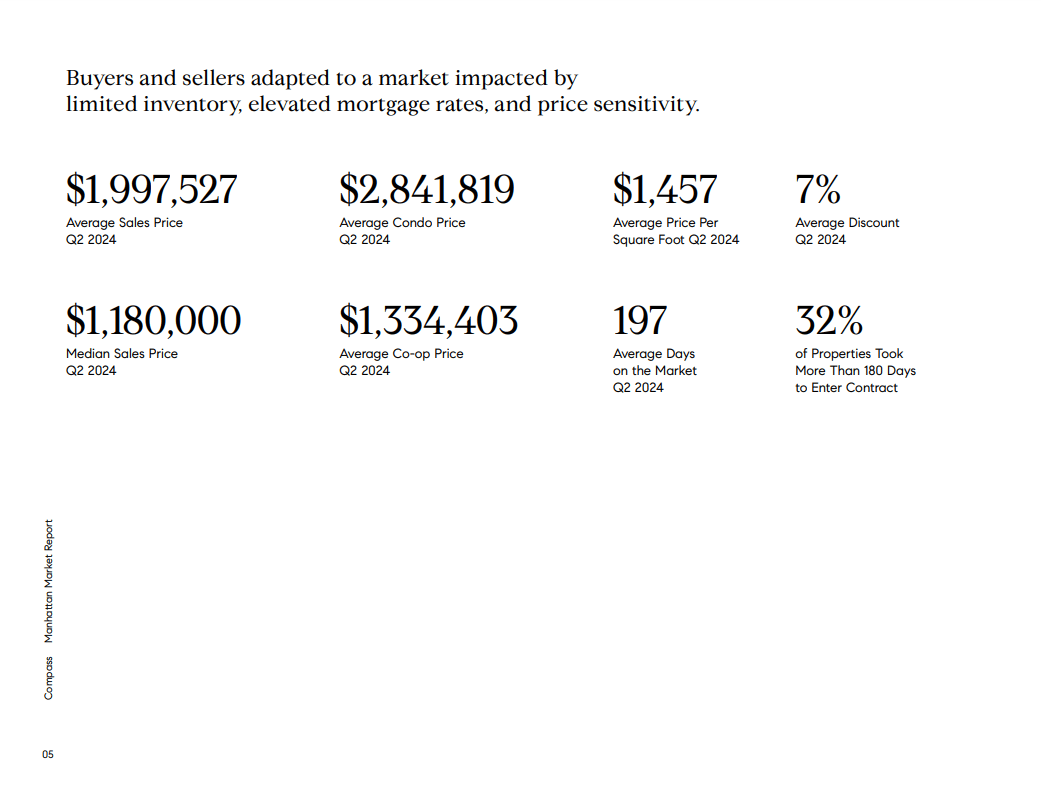
Q2 2024 Manhattan market report: $1,997,527 average sales price, $1,180,000 median price, 197 average days on market, and 7% average discount.


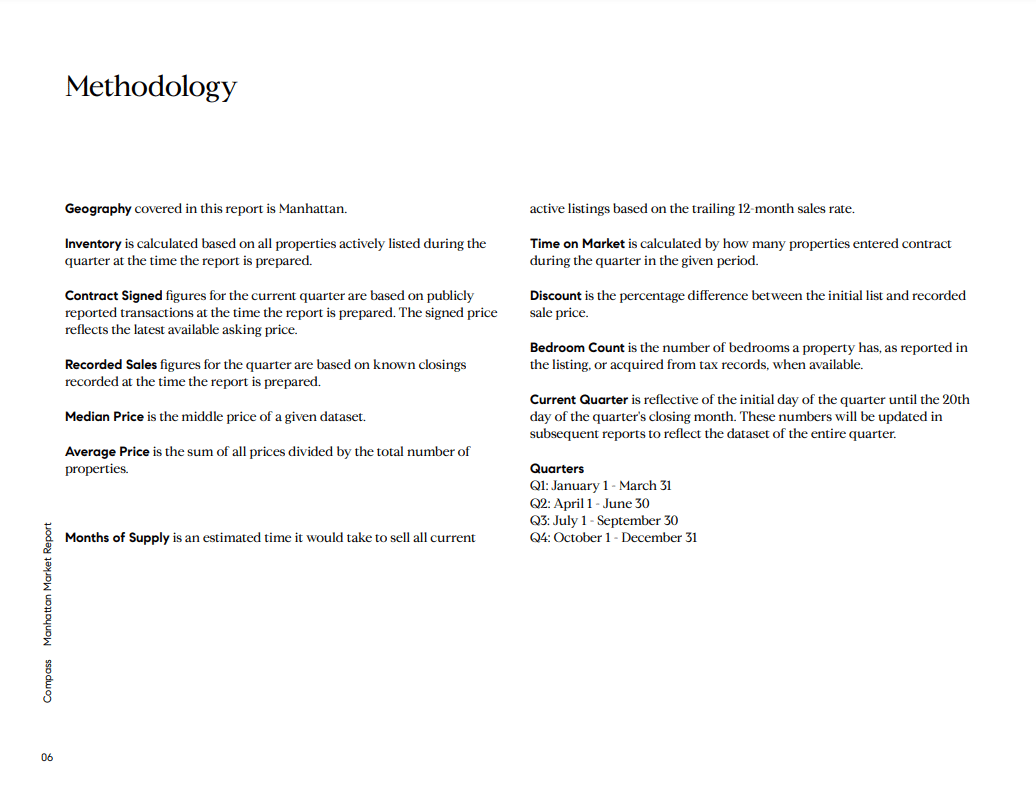
Methodology page defining Manhattan market report metrics and listing calendar quarter dates.


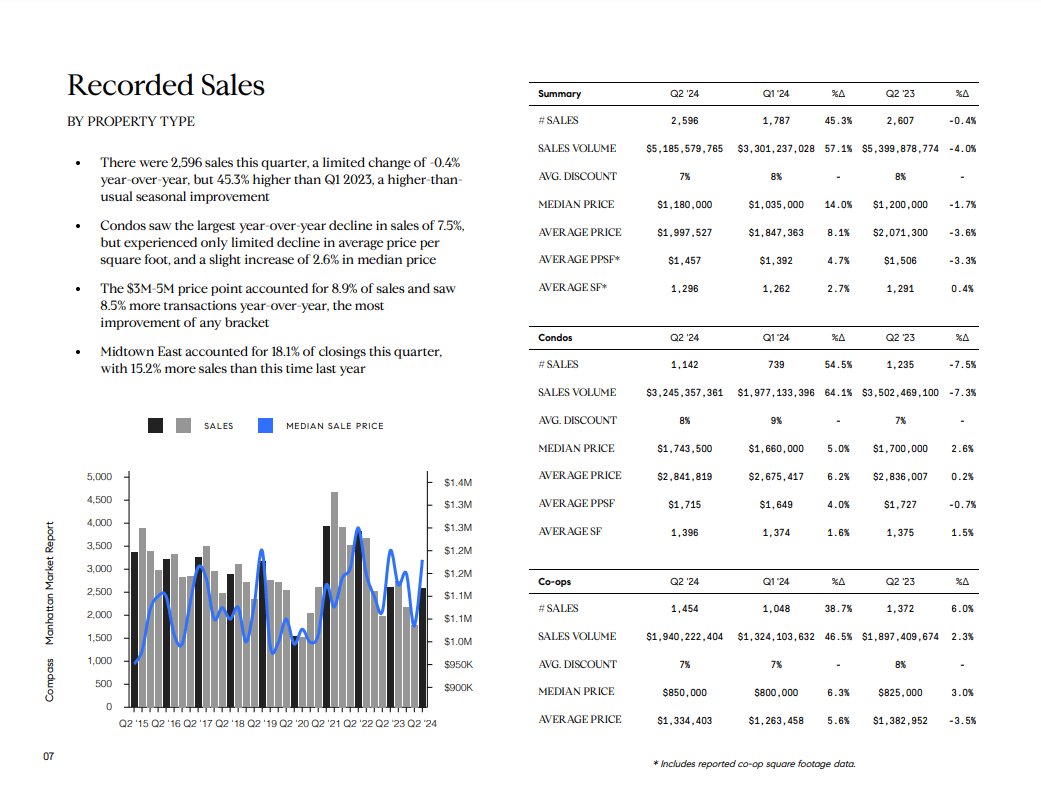
Manhattan recorded-sales report page with property-type commentary, a quarterly chart, and summary, condo, and co-op tables.


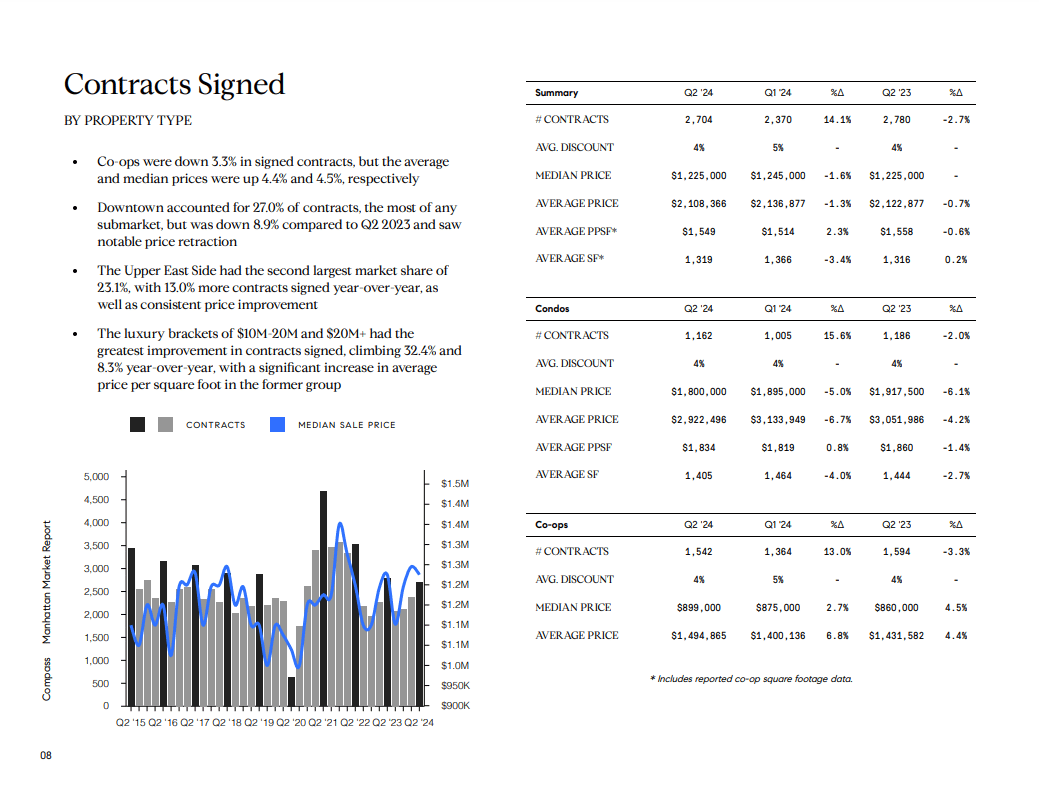
Q2 2024 Manhattan contracts-signed report with market commentary, pricing tables, and a quarterly chart.


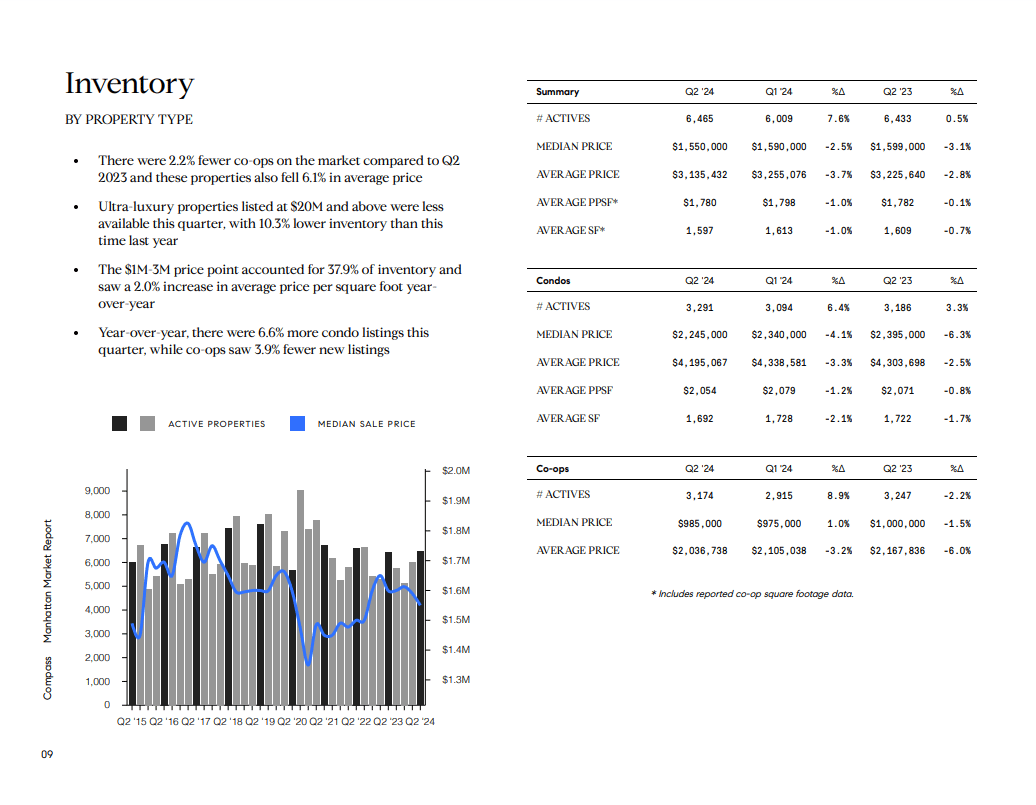
Manhattan inventory report with condo and co-op market tables and a quarterly chart from 2015 to 2024.


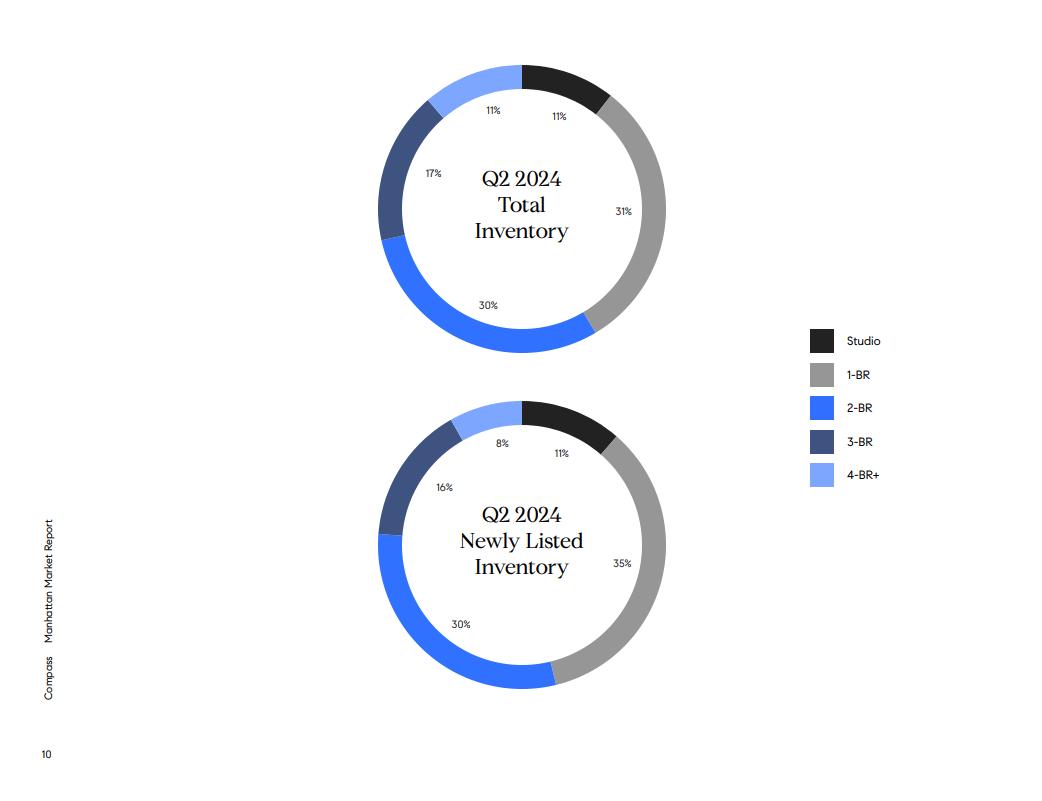
Donut charts compare Q2 2024 Manhattan total and newly listed inventory by apartment size.


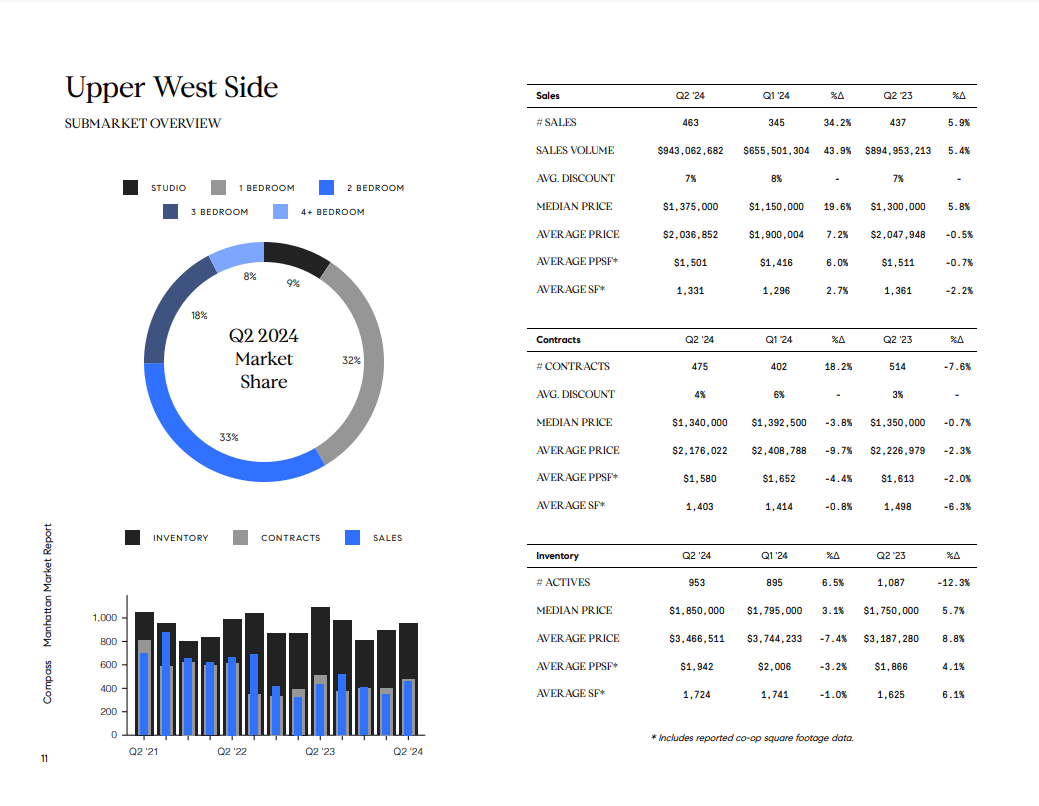
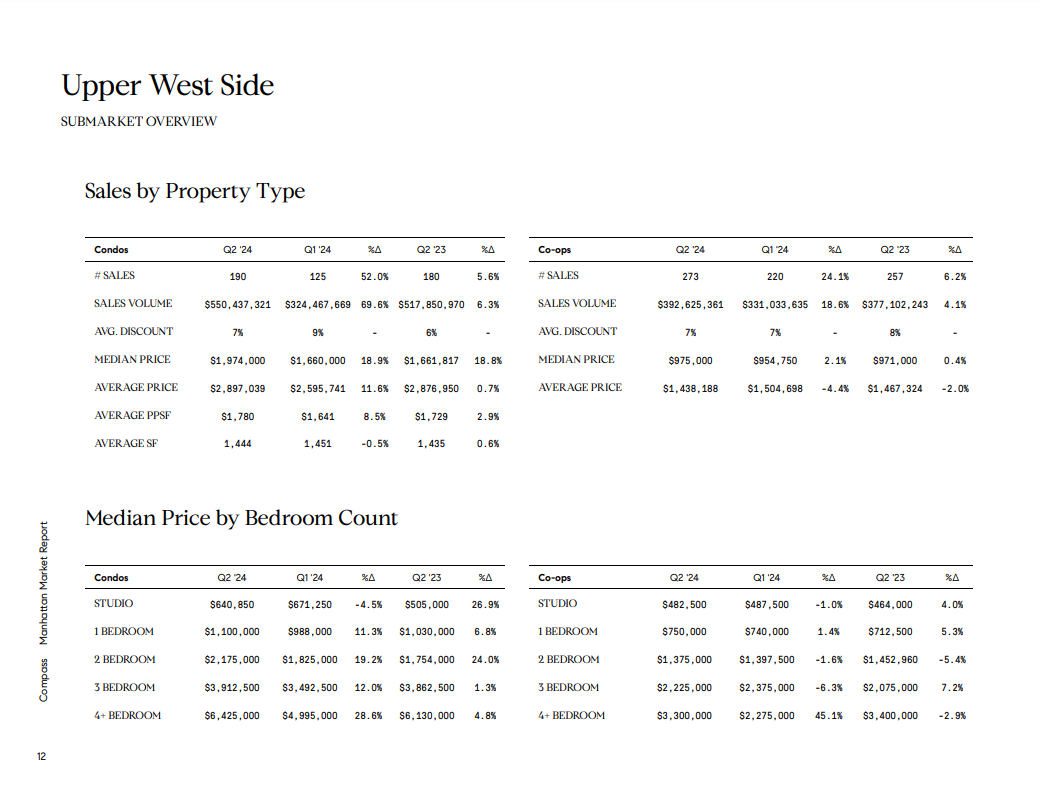
Upper West Side Q2 2024 market report with a market-share chart and market tables.


Upper West Side Q2 2024 sales and median prices for condos and co-ops.


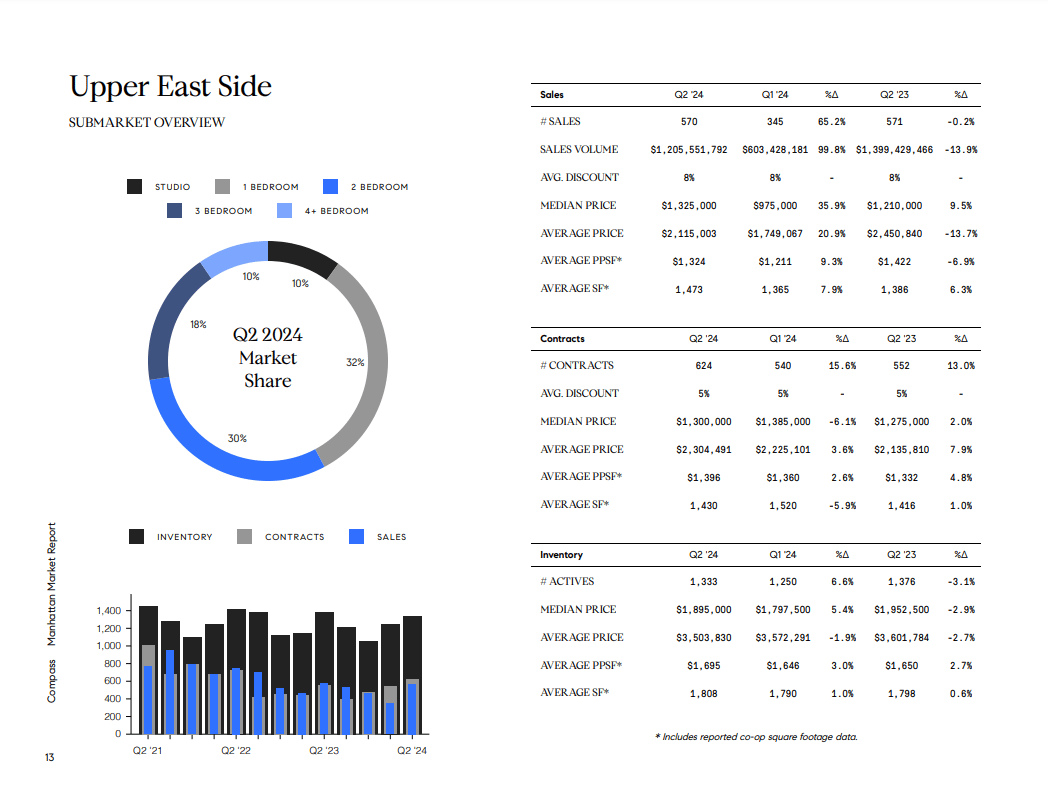
Upper East Side Q2 2024 market report with bedroom market-share chart, historical bars, and sales, contracts, and inventory tables.


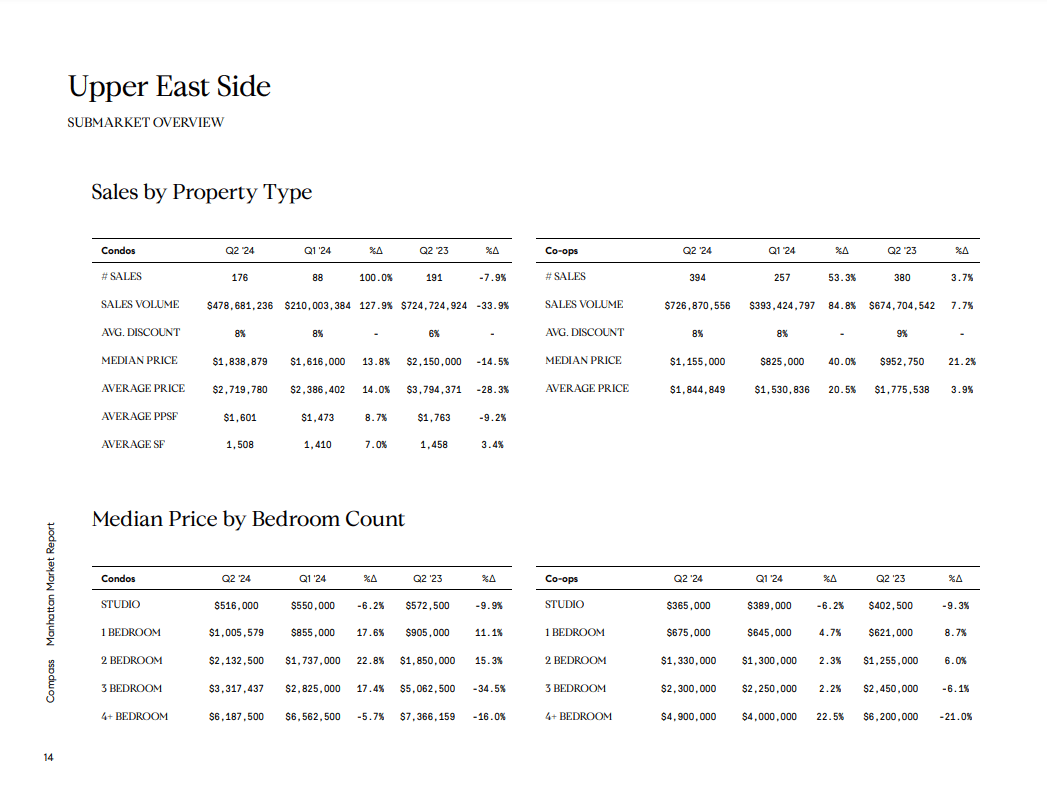
Upper East Side Q2 2024 market report tables comparing condo and co-op sales and median prices by bedroom count.


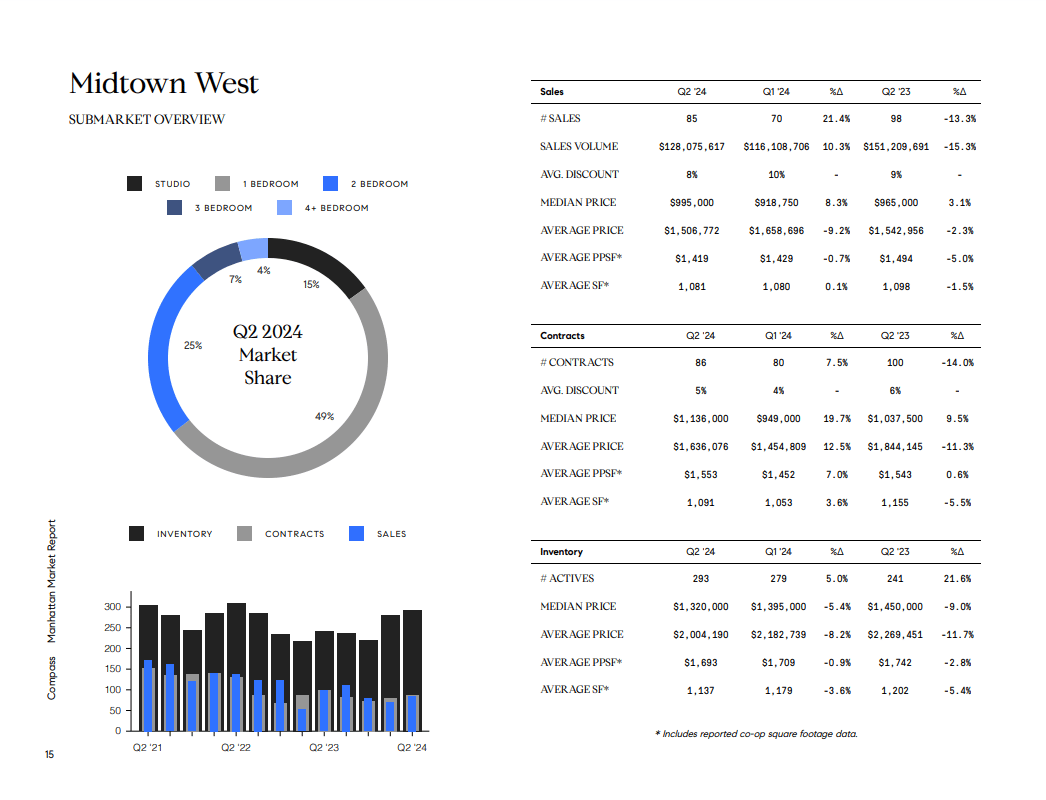
Midtown West Q2 2024 market report with bedroom market-share donut chart, quarterly bar chart, and sales tables.


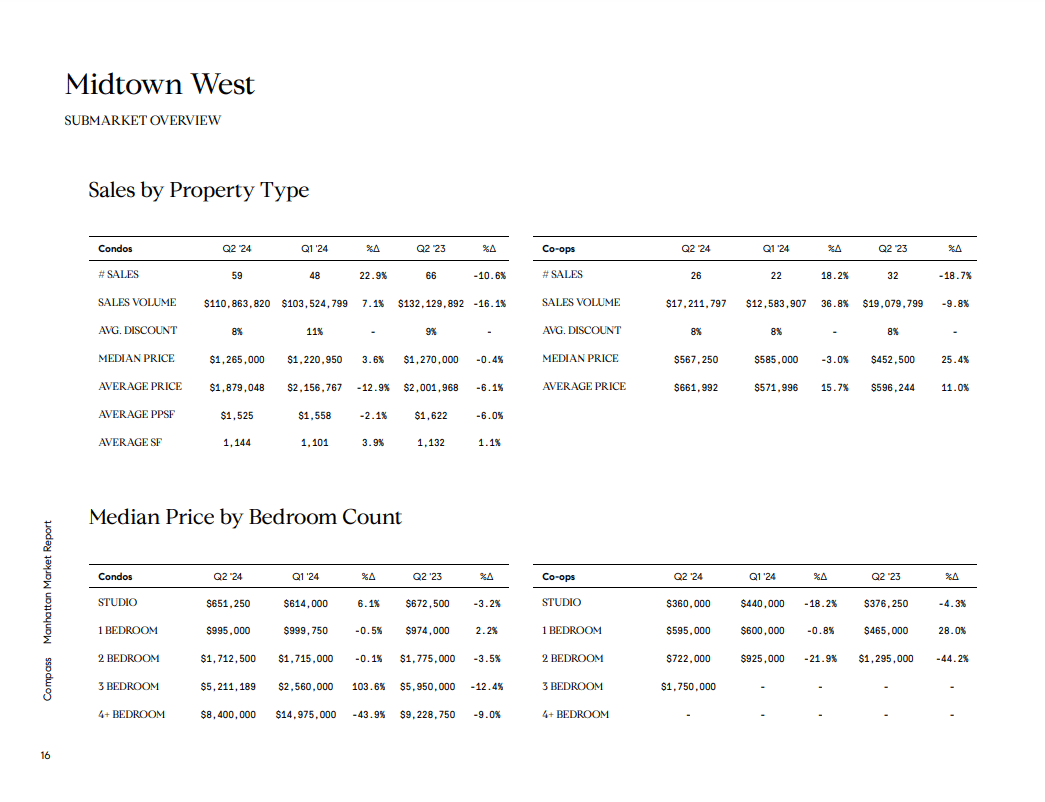
Midtown West market report tables compare condo and co-op sales and median prices by bedroom count.


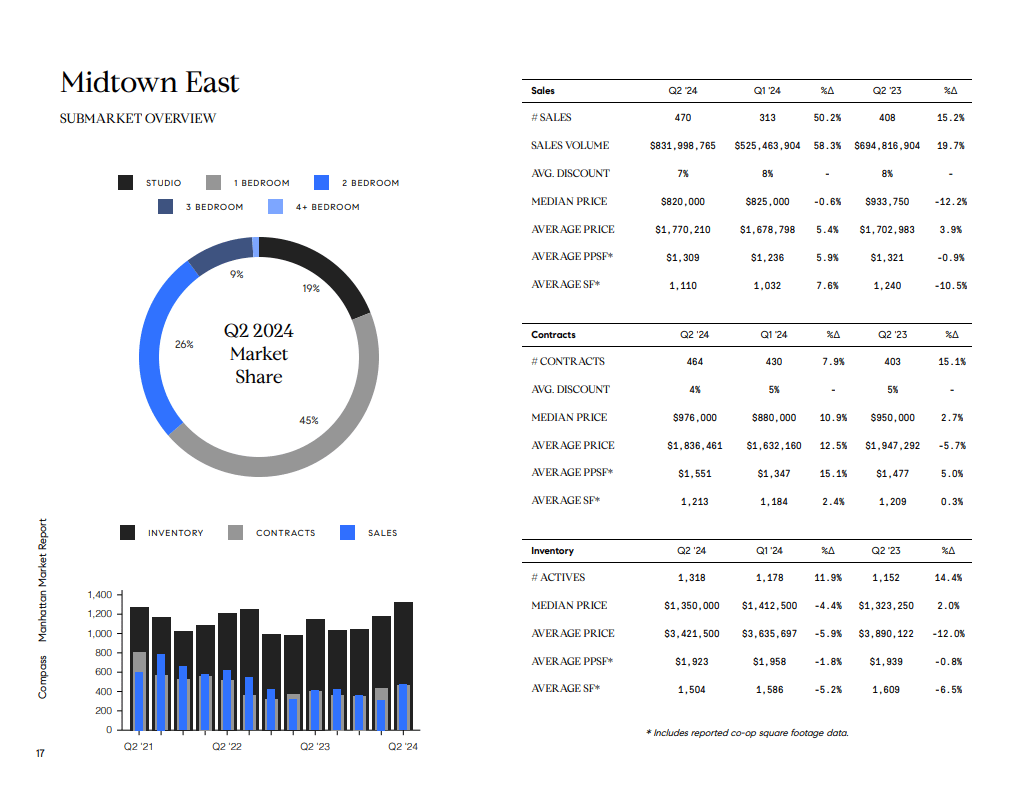
Midtown East Q2 2024 market report with bedroom market share, quarterly activity chart, and sales, contracts, and inventory tables.


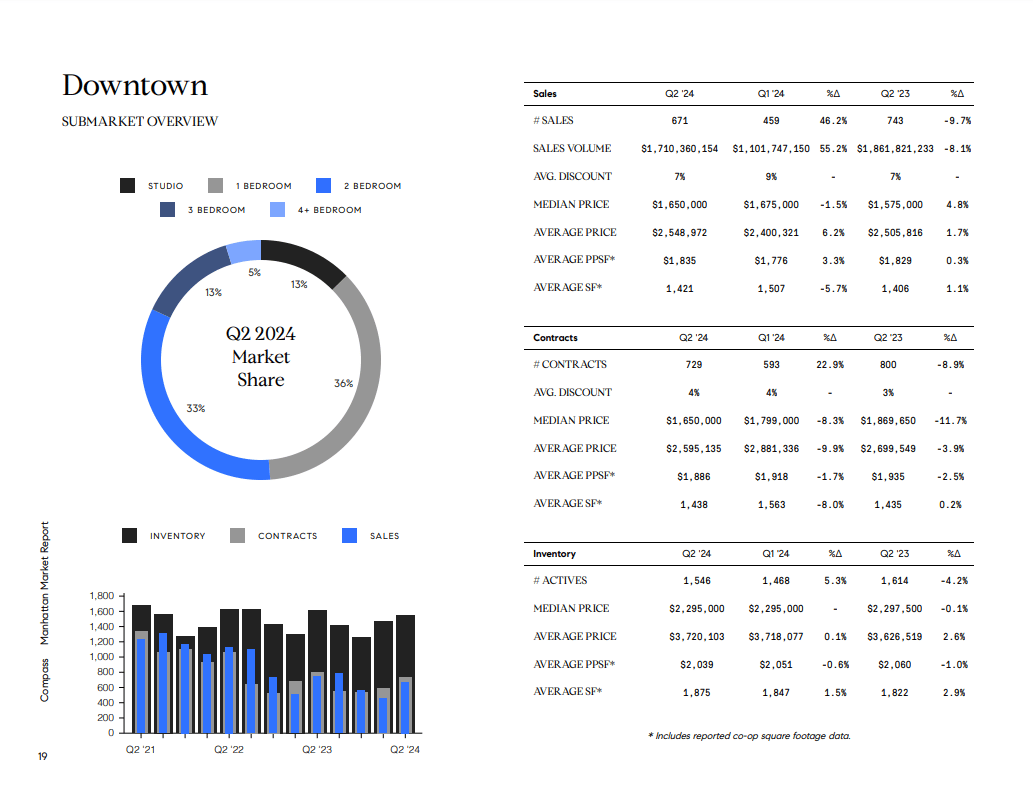
Downtown Q2 2024 market report charts and tables showing bedroom market share, sales, contracts, and inventory.


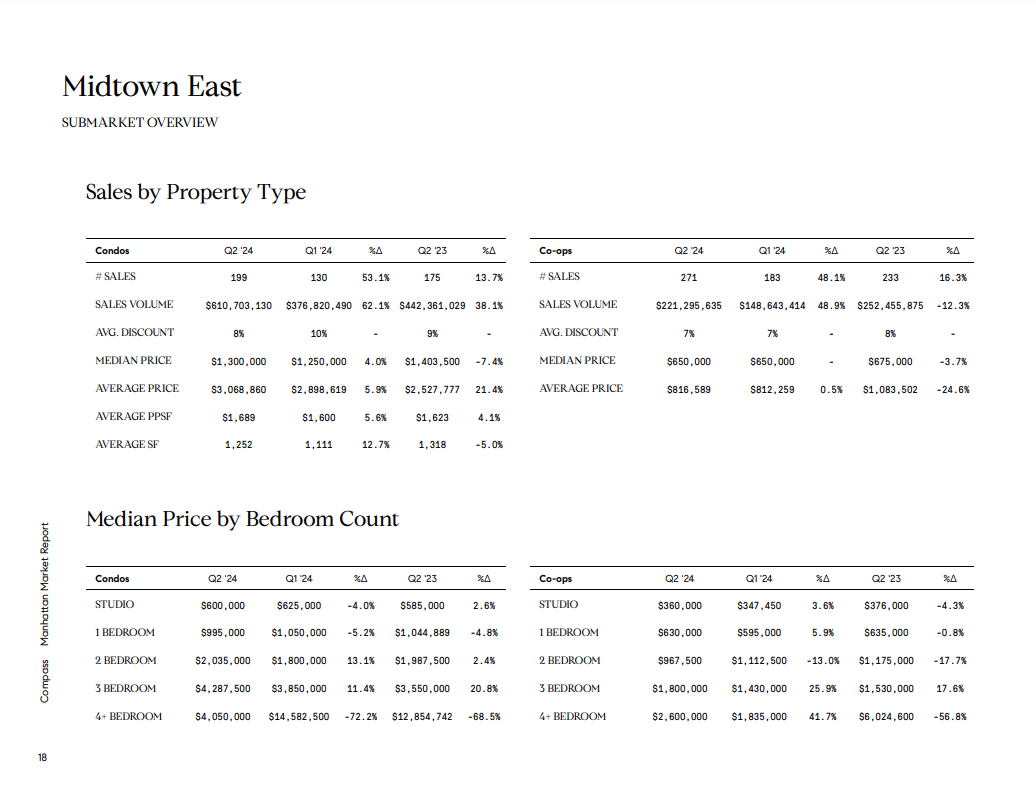
Midtown East market report tables comparing condo and co-op sales and median prices by bedroom count.


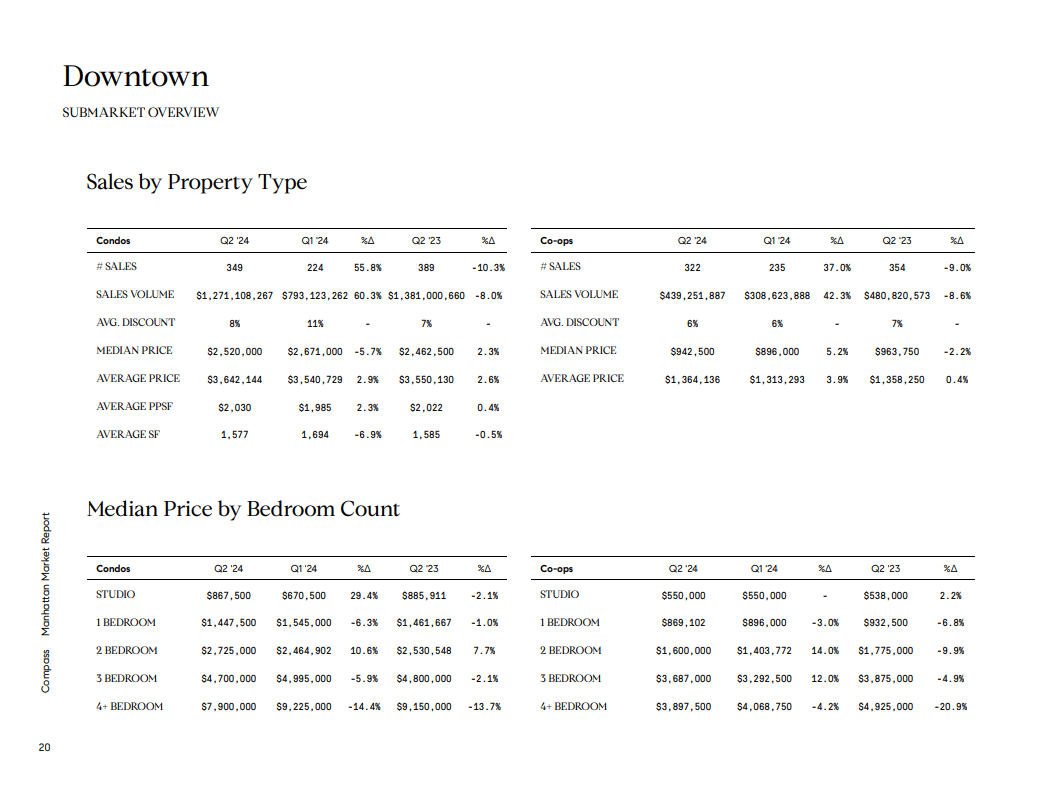
Downtown Manhattan market report tables comparing condo and co-op sales and median prices by bedroom count.


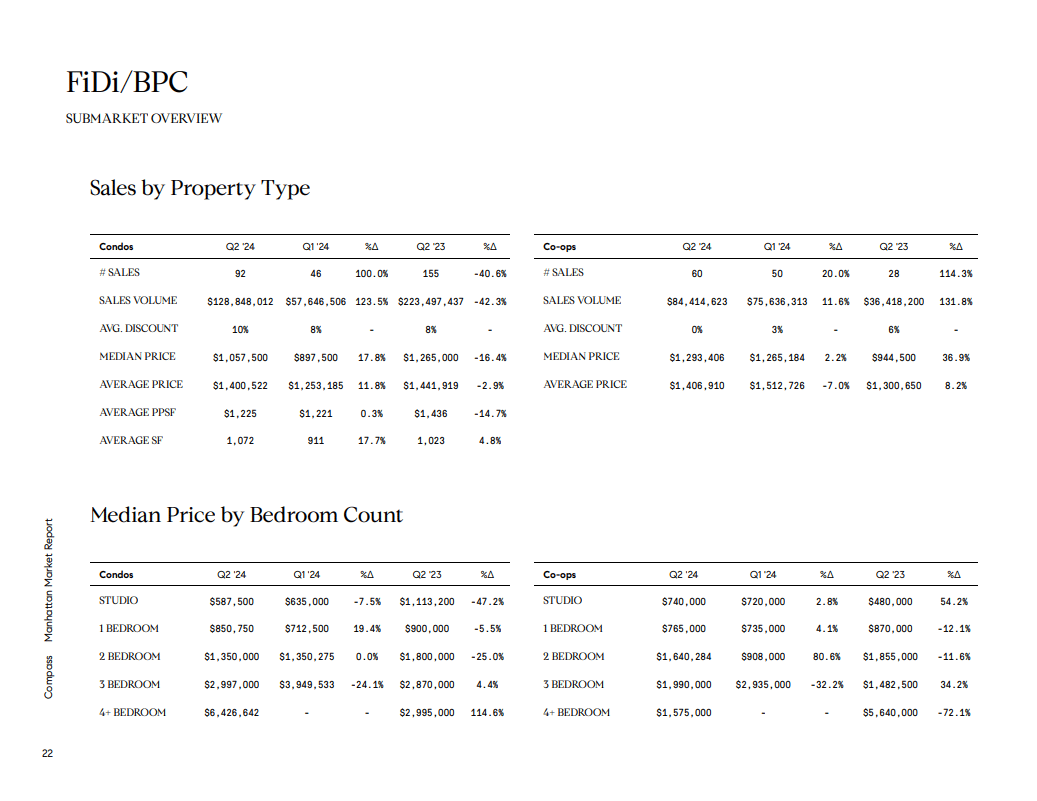
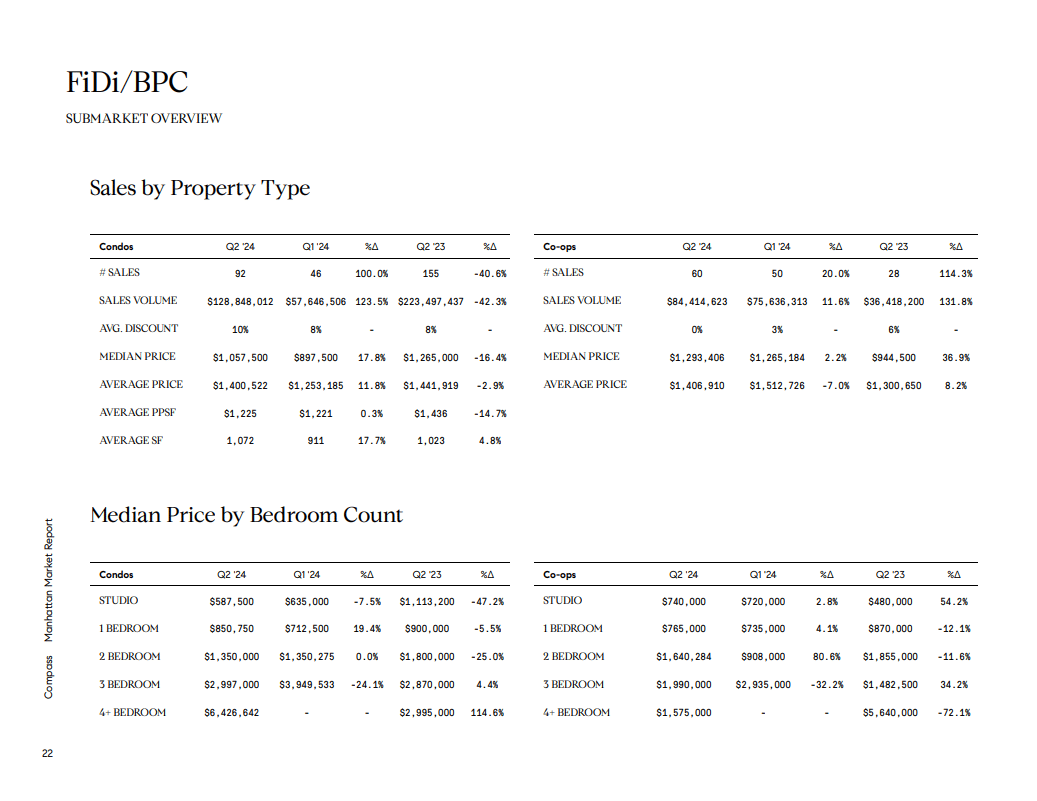
FiDi/BPC market report tables comparing condo and co-op sales and median prices by bedroom count.


FiDi/BPC submarket overview charts of Q2 2024 sales and median prices by bedroom count.


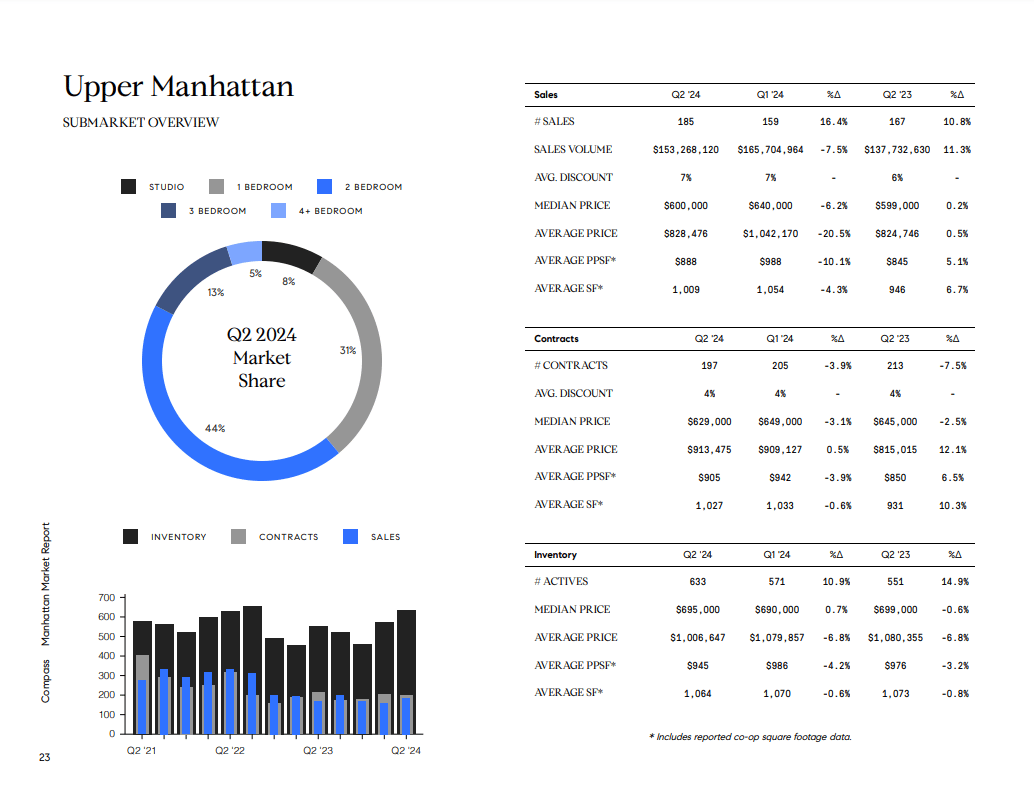
Upper Manhattan Q2 2024 market report with bedroom market-share chart and sales, contracts, and inventory tables.


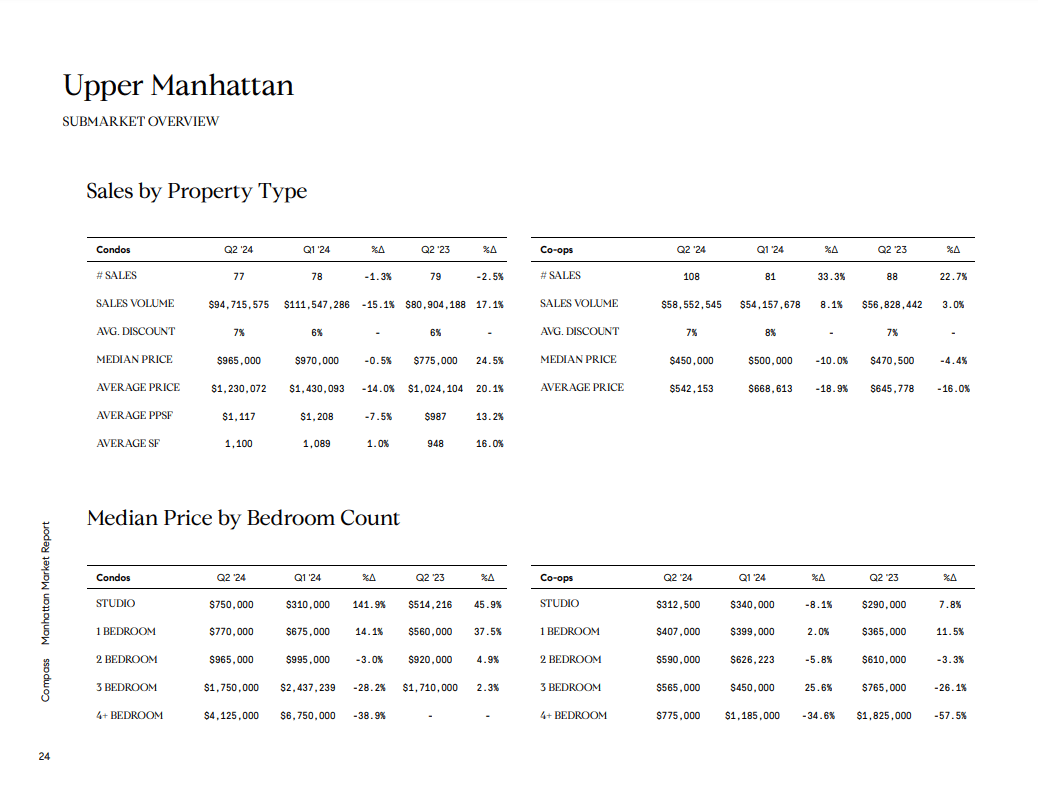
Upper Manhattan Q2 2024 report tables compare condo and co-op sales and median prices by bedroom count.


Compass


Everything You Need to Buy Your Next Home

Ready to find your dream home? Download our Ultimate Buyer’s Guide for expert tips, step-by-step advice, and everything you need to make your next move with confidence.

Sending...
Successfully sent!
link
New York buyer’s guide cover with an aerial view of a residential neighborhood.

Work With Us

Looking to buy, or sell, or just have a question? We are always available to help and would love to work with you. Contact us today to find out how we can be of assistance to you!

Follow Me on Instagram